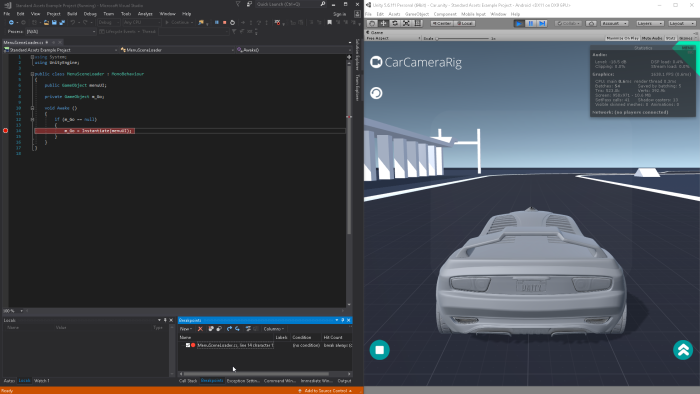
In this tutorial, you’ll see a project configured with VisualStudio. And how to run and debug it.
Steps
- Open the ‘Example’ project
- Choose a Script Editor
- Add breakpoint in source code
- Attach Script Editor to Unity3D
- Debug
1. Open the ‘Example’ project
In Unity3D:
- Projects > Open > ‘Example’ > (wait) > Open Scene > ‘Sample Scenes Scenes/car.unity’
- Edit > Play > (test it) > Play (or click Play button, or press Ctrl+P)


2. Choose a Script Editor
In Unity3d:
- Edit > Preferences > External Tools > ExternalScriptEditor: ‘MonoDevelop’
- Assets > Open C# Project


3. Add Breakpoint in source code
In VisualStudio:
- Open ‘SampleScenes/Menu/Scripts/MenuSceneLoader.cs’
- Add a breakpoint to line 14

4. Attach Script Editor to Unity3D
In VisualStudio:
- Click the little show button next to ‘Attach to Unity’ > Select ‘Attach to Unity and Play’

5. Debug
In VisualStudio:
- Click ‘Attach to Unity and Play’
- (it’s in pause now, stopped at the breakpoint line)
- Click Continue (or press F5)
In Unity3d:
- (play with it)
In VisualStudio:
- Click Stop (or press Shift+F5)


Conclusion
Pros: More productive than MonoDevelop (you don’t have to switch beetwen Editor and Unity3D to run a debug). Dark Them is nice too!

Cons: More heavy on CPU/RAM than MonoDevelop. And it’s a Microsoft product
Here is the same project opened on VisualStudio, MonoDevelop and a text Editor.

Source
https://github.com/DamienFremont/damienfremont.com-blog-labs/tree/master/20170603-unity3d-use-visualstudio-script-editor-and-debug/ https://github.com/DamienFremont/damienfremont.com-blog-labs/tree/master/20170603-unity3d-use-visualstudio-script-editor-and-debug/
References
https://unity3d.com/fr/learn/tutorials/topics/scripting/debugging-unity-games-visual-studio https://unity3d.com/fr/learn/tutorials/topics/scripting/debugging-unity-games-visual-studio


